
I am a Red Sox fan. If you follow me on twitter via @AV_MLBSweetSpot, then I am sure you have been aware of this for awhile now. The reason I have decided to state my team preference at the beginning of this article is because of the delicate topic that I am about to discuss. The current talk around the game is Giancarlo Stanton and his potentially record-breaking homerun pace. He has 44 through Wednesday and is on a pace that could bring him in the range of Roger Maris’s non-steroid record of 61. Stanton is a slugger for sure, and reaching the 60 homerun plateau would be an amazing accomplishment, but fans around the game need to pump the breaks. The level of hype and the “willing to trade anybody for Stanton” talks have become unreasonable, at least in Boston. That being said, I am not here to discuss the merits of Stanton’s recent surge. Instead, I want to talk about another player who, two months ago, was in the position that Stanton is currently in: Aaron Judge.
Entering the All-Star break, Aaron Judge was leading the league in homeruns with 30, and was slashing .329/.448/.691. He then proceeded to win the home run derby in his first ever try at the event, and was beginning to show real reason to call him the new “face of the game.” Since then, however, it seems that the Judge has come crashing down to reality, posting a .185/.346/.398. That line, in fact, is right along league average if you ignore the .185 batting average and instead consider the .346 OBP. But when accounting for the lowly .398 slugging percentage that is being produced from Judge’s 6’7″ frame, things could certainly be going better. The real question now becomes; who is Aaron Judge? Is he the .300+ AVG, 50+ HR hitter from the first half of 2017? Or is he a glorified version of Mark Reynolds? Well, I am here to answer that question for you. WARNING: the results are very positive, but something tells me that they still won’t be good enough for a chunk of the baseball community. To those people, I apologize (but not really).
What you are about to look at is a series of charts that extrapolate Judge’s current career stats and batted ball rates into a full-season projection. I have then adjusted the rates based on MLB players similar to Judge, as well as according to his rates in the minors and. The math behind it isn’t perfect I suppose, but I would be lying if I said I did not fully believe in my conclusions. Below I will provide Judge’s current career stats (through Monday, August 14th), followed by my charts and analysis. Comments/criticism are welcome. Enjoy!
Aaron Judge (Career through Monday)
140 G, 588 PA, 16.3% BB%, 33.8% K%, 16 2B, 3 3B, 40 HR
.270 AVG / .395 OBP / .563 SLG / .958 OPS
BABIP (Batting Average on Balls in Play)
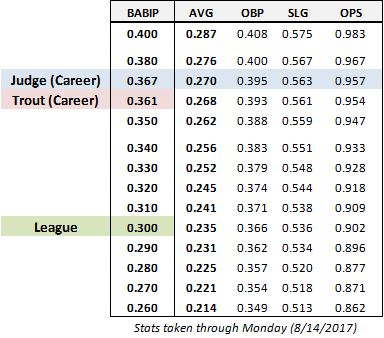
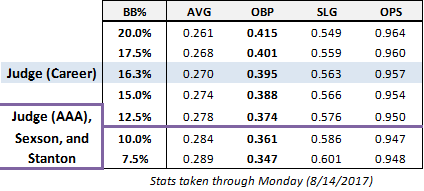
The first chart lists Aaron Judge’s BABIP to this point in his career, alongside the career BABIP of Mike Trout and the year to year league average BABIP (which typically falls between .298 and .303 in a given season). As BABIP goes up or down, a player’s batting average moves in the same direction along with it. The image above shows what Judge’s stat line would look like at each BABIP between .260 and .400.
While the league average BABIP is the normal comparison, there are many players who manage to achieve rates higher or lower than their peers depending on factors such as Hard-hit percentage, GB/FB rates, and a player’s speed. Since Judge has been ripping the cover off of the ball, it is not unreasonable that his BABIP could settle well above league average. I do not, however, believe that Judge can maintain Mike Trout levels for an entire season on a regular basis, especially considering his .250 BABIP since the All-Star break. I believe that Giancarlo Stanton’s career rate of .319 is a good basis point for Judge, so I would not be surprised if Judge manages something around .320 on a season-to-season basis.
HR/FB (Home Run / Fly Ball Ratio)
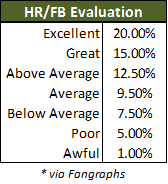
 There is a lot to take into account with a player’s HR/FB ratio, including their home ballpark. While the chart to the right (provided by FanGraphs) is a good starting point, I typically imagine that the league’s top homerun hitters will fall in the 20% to 25% range throughout their careers.
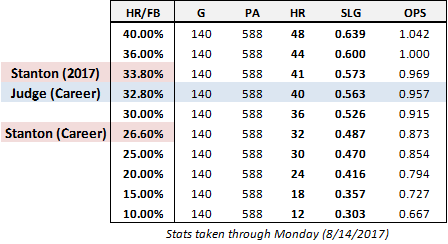
For a player who calls Yankees Stadium home, that 25% could easily be beaten. The chart above (bottom image) lists how many homeruns Judge would hit at each HR/FB rate given his current career trajectory. It also lists the subsequent effect that it would have on his slugging percentage. Again, I chose Stanton as a point of comparison given that he is the most noteworthy homerun hitter in today’s MLB.
Stanton, in the middle of a career year of his own, has managed an absurd 33.8% HR/FB rate. Judge’s career so far has almost matched that, coming in at 32.8% through almost a full-season’s worth of games. A more realistic rate would be Stanton’s 26.6% career number, but given that half of Judge’s games are played at Yankee Stadium (and another quarter of them in AL East ballparks), something approaching 30% is not out of the question.
K% (Strikeout Percentage) and BB% (Walk Percentage)
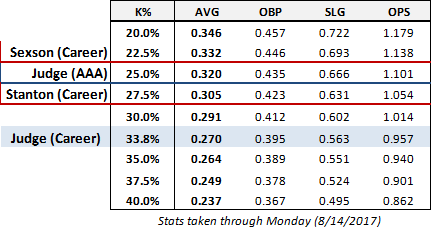
The last two variables that I have chosen to examine are strikeout and walk rates. There are certainly many other factors that affect a player’s final stat line (such as GB/FB rate, IFFB%, etc.), but I think that these two, coupled with the prior pieces of information, are enough to paint a general picture. For this section, I have chosen to compare Aaron Judge’s career rates with his own AAA rates (~26.2% K%, ~11.3% BB%), the career rates of Richie Sexson (another slugging behemoth) (23.4%, 10.5%), and the aforementioned Giancarlo Stanton’s career numbers (27.9%, 11.7%).
For starters, I believe that Judge is, and will remain, better than Richie Sexson ever was. Stanton is likely a better comparison. Additionally, there are two primary ways that hitters can improve strikeout rates: by improving their contact rates, or by swinging at more pitches earlier in the count. I do believe that Judge will improve his strikeout rates enough to prevent him from becoming another Mark Reynolds; however, if he achieves that improvement through the means of swinging earlier in the count, then that would also act to lower his walk rate. Therefore, while I understand that Judge has been walking at elite rates thus far in his career (16.3%), I am skeptical that he can maintain a number over 15% year-in-year-out. If he did, with his power, he would be putting himself near the realm of names like Joey Votto, or dear I say it Barry Bonds. Sorry Yankees fans, but I do not believe that Judge is that type of player.
Ultimately, with seasoning, I feel that it is reasonable to expect an improvement in strikeout rate that brings Judge closer to Stanton’s career number of 27.9%, while also maintaining a walk rate that is in-line with his AAA numbers and those numbers of Stanton and Sexson. Accounting for intentional walks and some improvement, a 12.5% walk rate seems reasonable to me. In the section that follows, I have put together all of this information and come to a conclusion on Judge’s career trajectory.
Career Projections (140-games per-season basis)
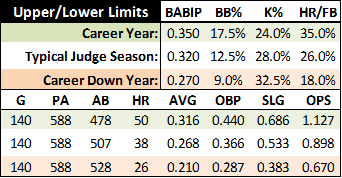
The 140-games per season seems a bit low in my opinion, at least early in Judge’s career. I would peg him more at 150 games until he gets a bit older and starts needing more days off to prevent injury. As such, I imagine a typical season for Judge should see him finish in the 40 homerun and .900 OPS range (see image above). A career year, and possibly an MVP-type season for New York’s slugger could see him put up more than 50 homeruns, while a down year would still leave him in the mid-20s.
In terms of batting average and on-base percentage, Judge’s development in the strikeout and walk departments will have a major impact. I see him reasonably settling into the .260-.270 range, again with some .300 potential in a career year and a lower .200 average in a down year. Despite where his batting average lands, I would not be surprised to see Judge land in the .350 OBP range throughout most of his career, naturally with some room for highs and lows along the way.
At the age of 25, Aaron Judge has already proven to be a force. Should he manage a 10 to 15-year career, I have every reason to believe that he could tally 400+ homeruns and 1000+ RBIs. That is a bold statement to make about a guy who has yet to finish his first full major league season. Somewhere down the line, if he can manage to adjust to pitching as MLB hurlers adjust to him, Judge has the offensive potential to add an MVP to his resume. Even if he doesn’t achieve that level of success, a guy who manages a .268/.366/.533 stat line with 40 homeruns is bound to win multiple Silver Sluggers and find himself a member of many All-Star teams. One comparison that keeps coming to mind is Adam Dunn, who is actually quite a good barometer, although Judge will probably hit for more average throughout the course of his career. Considering that Dunn was around during much of the steroid era, when balls were flying out of ballparks at a higher rate than they ever had in the past, this is a better comparison than people realize. Then again, 2017 is shaping up to have record-breaking homerun rates as well. No matter the means, it is thanks to Judge and company that the Bronx Bombers are beginning to re-establish themselves as an offensive force, a force that should be present for years to come.


Age wise Mark Reynolds is a better comparison…..
LikeLike
You didn’t factor age as a true comparison. Judge being 5 years older than Trout and Stanton at the 140 mark. Totally not apples to apples as 25 is a lot different than 20.
LikeLike
The comparisons were full career numbers, not where trout or Stanton were at the 140 games mark. They are meant more as a benchmark to try and provide some landscape as to what type of player tends to maintain each rate.
I definitely see where you are coming from, but the basis of the article does not require perfect alignment per age and games played.
LikeLike
Sqa
LikeLike
Sqa
LikeLike